About Visualizer
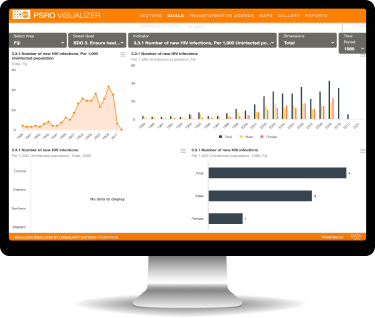
DFA Visualizer allows to query an underlying data warehouse and view the whole content. Users can select the desired area and indicators and view data by trend, disparities across time periods and geographies. Data can be displayed in the form of charts and maps.
Users can also customise visualisations and save then in an online personalized gallery. They can also download data sets in Excel.
Features
Zero learning curve tool to quickly search for data from your data warehouse. Readily available visualisations created on the fly that you can easily customised to your needs, download and share
Should you want to create your own visualisation by comparing two different indicators, this can also be easily achieved.
Explore
The Data Visualiser allows to query the entire data warehouse and generate visualisations. It has intuitive filters that allow users to define their search.
Edit and create visualisation
Users have an extensive menu of features to edit and create the visualisations and customise them as per their needs.
Gallery
Visualisations can be saved in the user’s online gallery for future reference. It is a dynamic space where visualisations can be edited, deleted and copied.
User Registration
Users can create an account that will allow them to save their visualisation in their own online gallery.
To visit Data Visualiser click here